Ever been asked to deploy a machine learning model that outputs a "vector" or an "embedding"? Perhaps you've been asked to set up vector search over some text embeddings, and as soon as you look into it you find there's a bewildering array of options and parameters you have to pick from. This article is a short explainer to help the uninitiated find their way around one of those - picking the right distance metric.
Similarity as a measure of distance
Searching for an exact match in a database is relatively easy, but finding a similar match is much harder. Even defining what we mean by "similar" is complex and contextual, but broadly we need some way to say that some thing A is more similar to B than it is to C, without necessarily having a direct measure of how each of those things relate. And of course we must find a way to calculate that similarity in a way that is fast enough to be of use.
But if we can manage to do that in a general context, we unlock a lot of cool capabilities - being able to identify whether two pieces of data are likely the same thing (such as in image recognition) or searching over large datasets based on descriptions or context rather than vocabulary (such as in semantic search).
One machine learning technique for approaching this problem is to use an embedding model. Let's dive into what that means.
Multi-dimensional spaces for mapping similarity
Machine learning models often output coordinate values or "vectors" in "low-dimensional space". For someone who lives in a 3-dimensional world, 768 dimensions might sound like a lot, but it is certainly far fewer than, for example, the number of dimensions you would need to accurately describe every possible 10-word sentence in English. Each word could have (conservatively) over a million possible values, meaning if we had each possible word as a 1 or a 0 in each position, we'd need 10-million-dimensional space to accurately define a sentence. And that's ignoring that some sentences (such as this one) have more than 10 words, and come with punctuation, proper nouns and many other complications.
"Wait!" I hear you cry - "why don't we just use 10 dimensions, with each value corresponding to a different word?" So 1 for "wine", 2 for "cheese", 3 for "electromagnetism" and so on? Well, we could use a vocab table for looking up values like this, but the disadvantage is that the numbers wouldn't mean anything. To use ML jargon, the vector wouldn't "encode" any semantic meaning, and so wouldn't be algorithmically useful if we wanted our model to know that "cheese" and "wine" are words much more closely related than "cheese" and "electromagnetism".
Something similar is happening with the colours of pixels in images, or the amplitude of samples in audio files, as well as in many other scenarios.
This is why ML researchers have developed models that "embed" the approximate meaning of some higher dimensional data into lower dimensional representations of hundreds or thousands of numbers. Some well-known open source examples include CLIP and BERT, but these days there are many models available, including a great many proprietary ones only available via API.
What all of them have in common is that the output vectors define some reason relating to how close they are to which other vectors. The term for describing how we measure the distance between two such vectors is a "distance metric", and below we're going to look at the most common ones.
Note: The diagrams below are all in 2D, because I drew them on a virtual whiteboard to appear on the flat screen you're using to view this. Just trust me that all of them exist and work the same way in any number of dimensions.
The distance between two points
If we consider two points A and B that have been returned by our model of choice, we are faced with the
question of how to measure how close they are to each other:
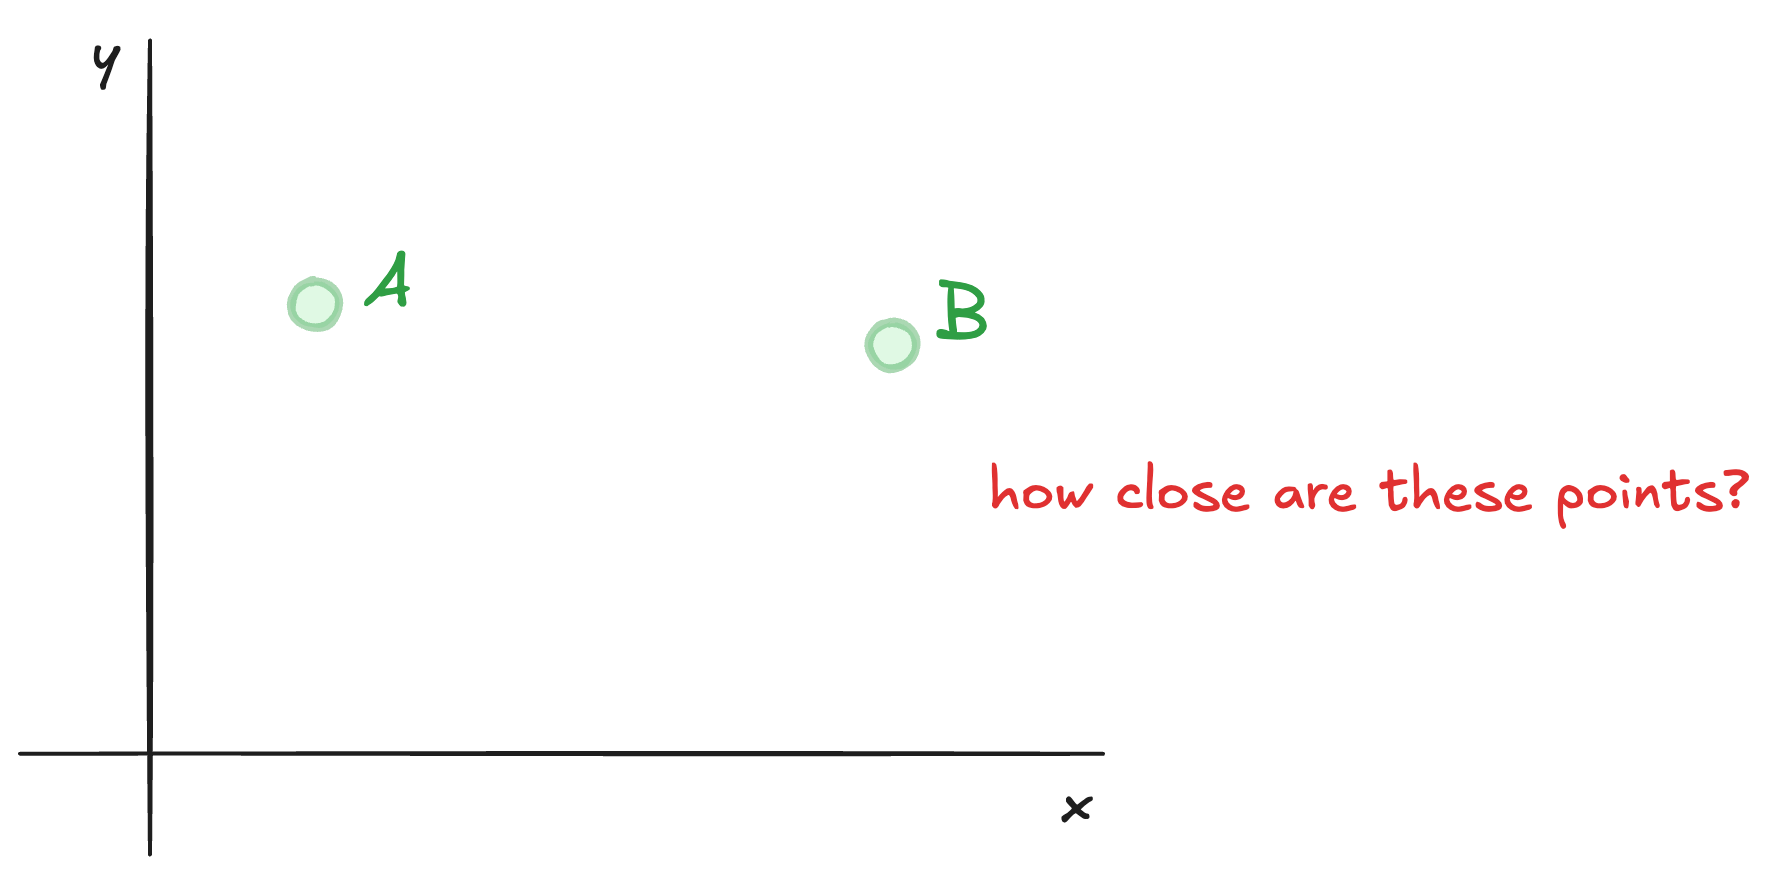
Let's start with most obvious one.
L2 "Euclidean" distance
"Chris, this is easy! You just draw a straight line between them and find that distance, right?"
Like so:
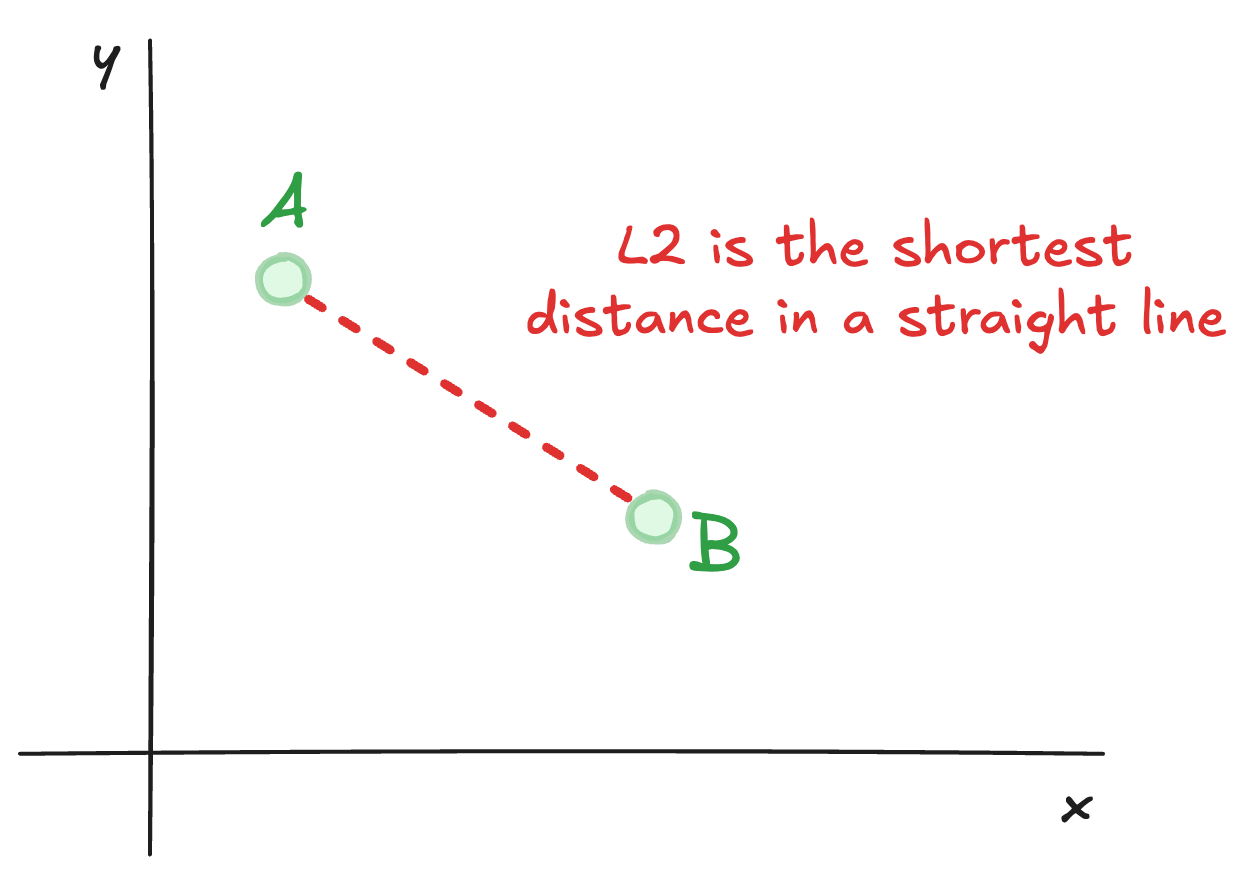
Well, yes, you got it - this is called the Euclidean distance (by most people),
or the L2 norm (by ML nerds),
and is largely the way
we think of distance in our day-to-day lives.
How can we calculate it? Well our old chum Pythagoras taught us that - find the difference in each dimension, square those, add them up and then square root the whole thing:
1L2 = math.sqrt((x2 - x1)**2 + (y2 - y1)**2)
Despite its popularity with old dead Greek dudes, Euclidean distance isn't the only game in town, and is actually rarely used for embedding models for a few reasons (it is expensive to calculate, it is overly sensitive to outliers, etc).
Let's look at its cousin, the hilariously simple L1.
L1 "Manhattan" distance
So called because it resembles how a NY taxicab drives around Manhattan, the L1 distance effectively describes the distance
that Pacman would have to walk to get between two points:
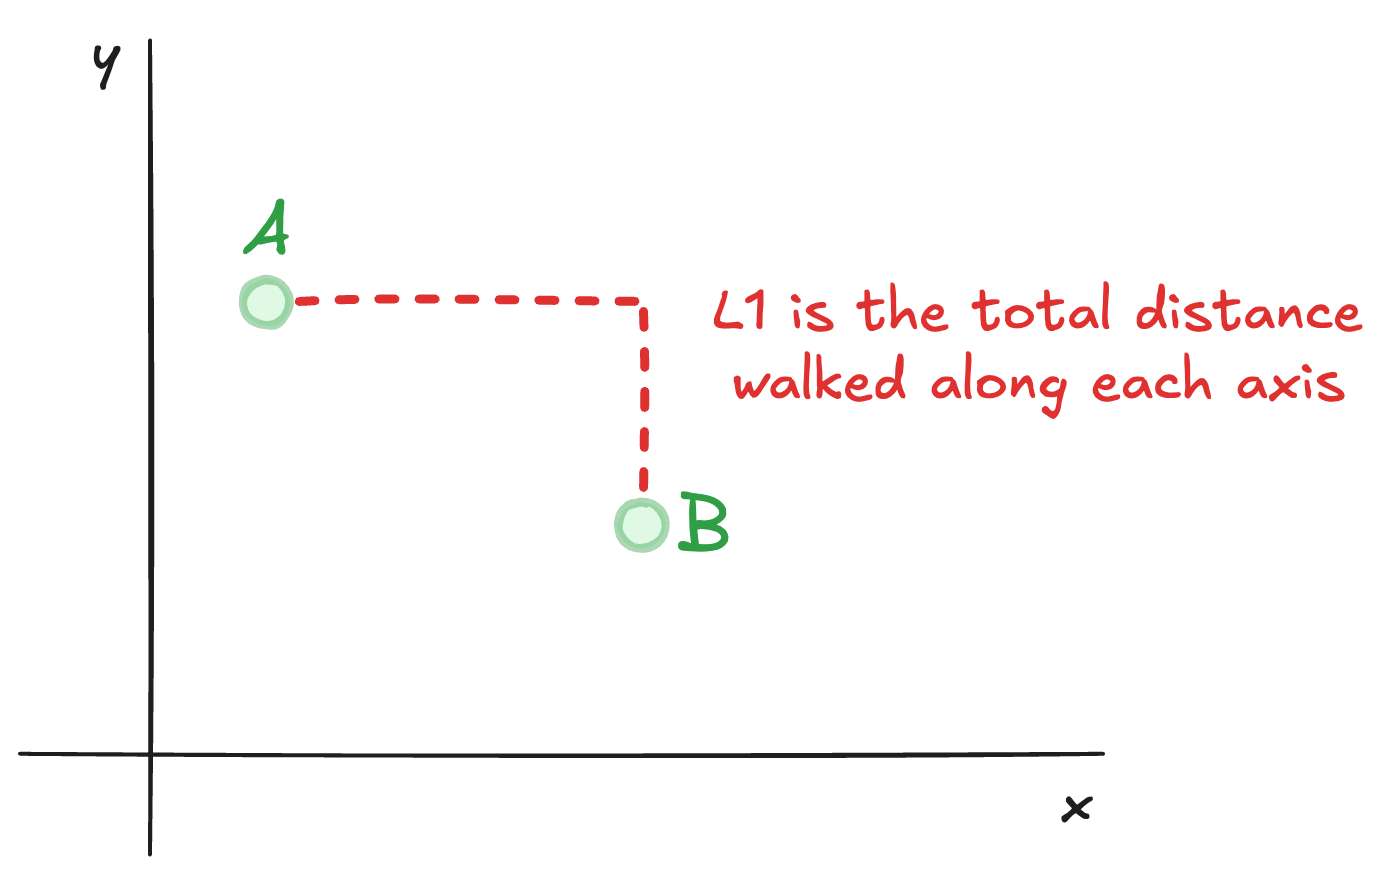
It is very easy to compute:
1L1 = abs(x2-x1) + abs(y2-y1)
There are situations in which measuring distance like this makes a lot of sense, and like L2, some models do use L1 as their primary distance metric.
However, to get to the measures that are most common for today's embedding models, we first need to think about why we are mostly talking about "vectors" rather than coordinates.
Vectors
A vector is a magnitude plus a direction. Physicists will get excited thinking about vector fields for things like magnetism, where each point in a multidimensional space has some amplitude and direction associated with it.
In machine learning, when we talk about vectors we usually just mean the vector that gets you from the origin (where x, y and everything else is zero) to our point in question. Vectors are arrows, and you see how we can think of our coordinates as vectors driving out from the same point:
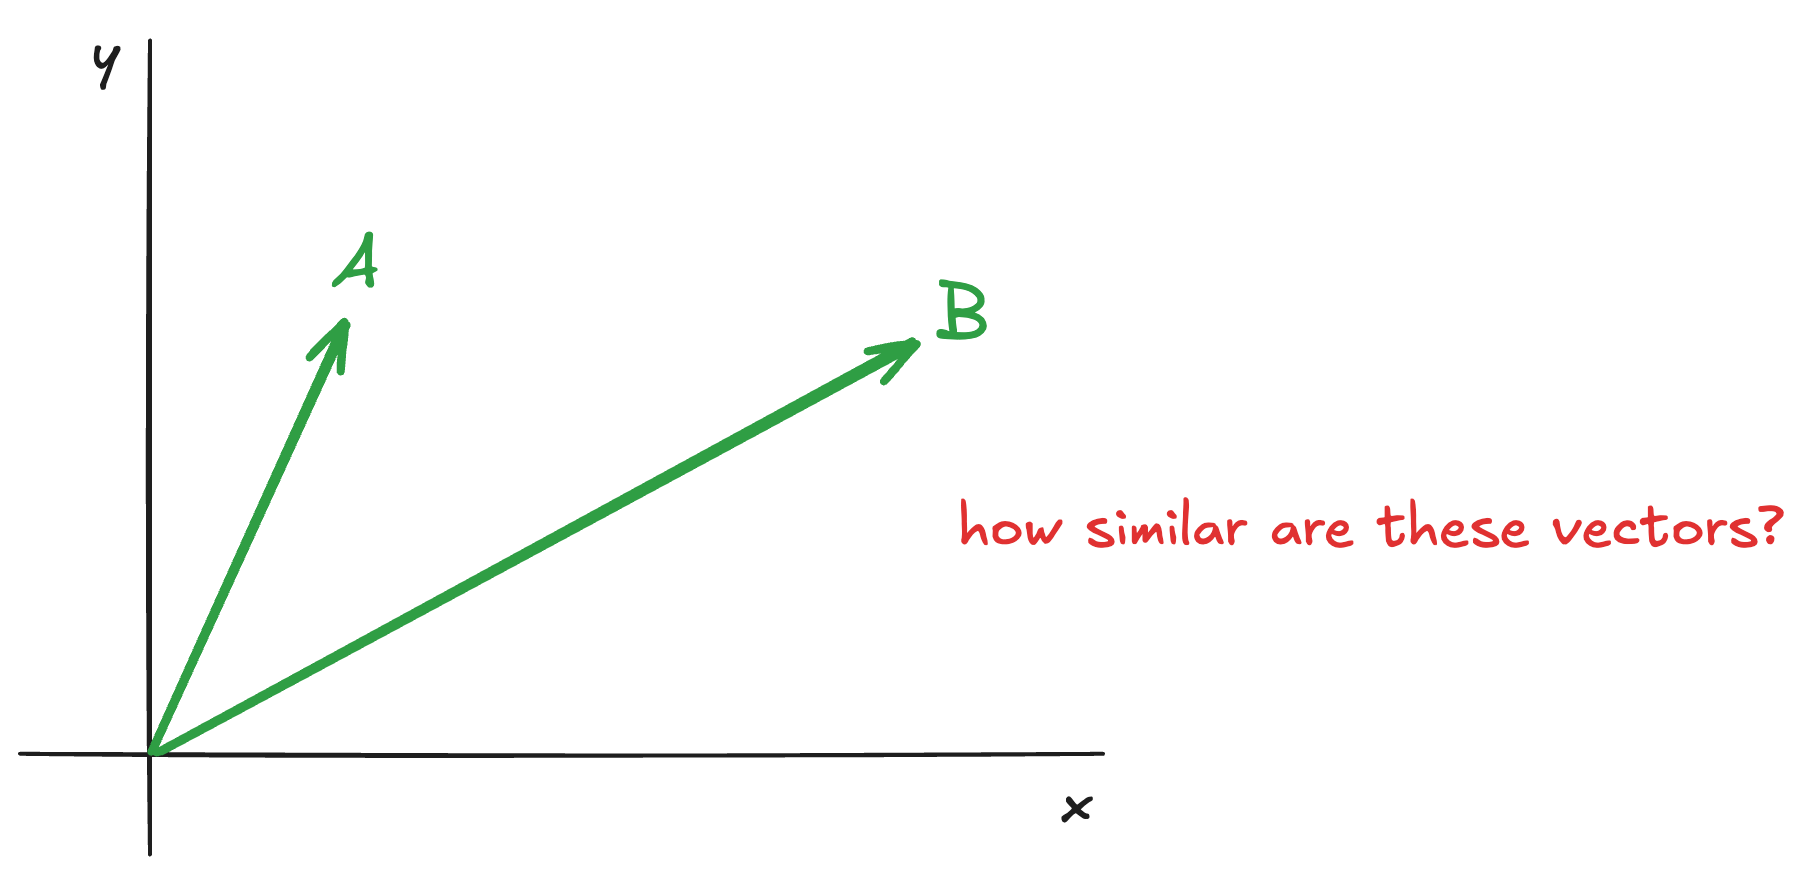
Why is this helpful? Well, it means we can start to think about "closeness" between our coordinates simply being closeness of direction, by looking at the angle between the two vectors that describe them:
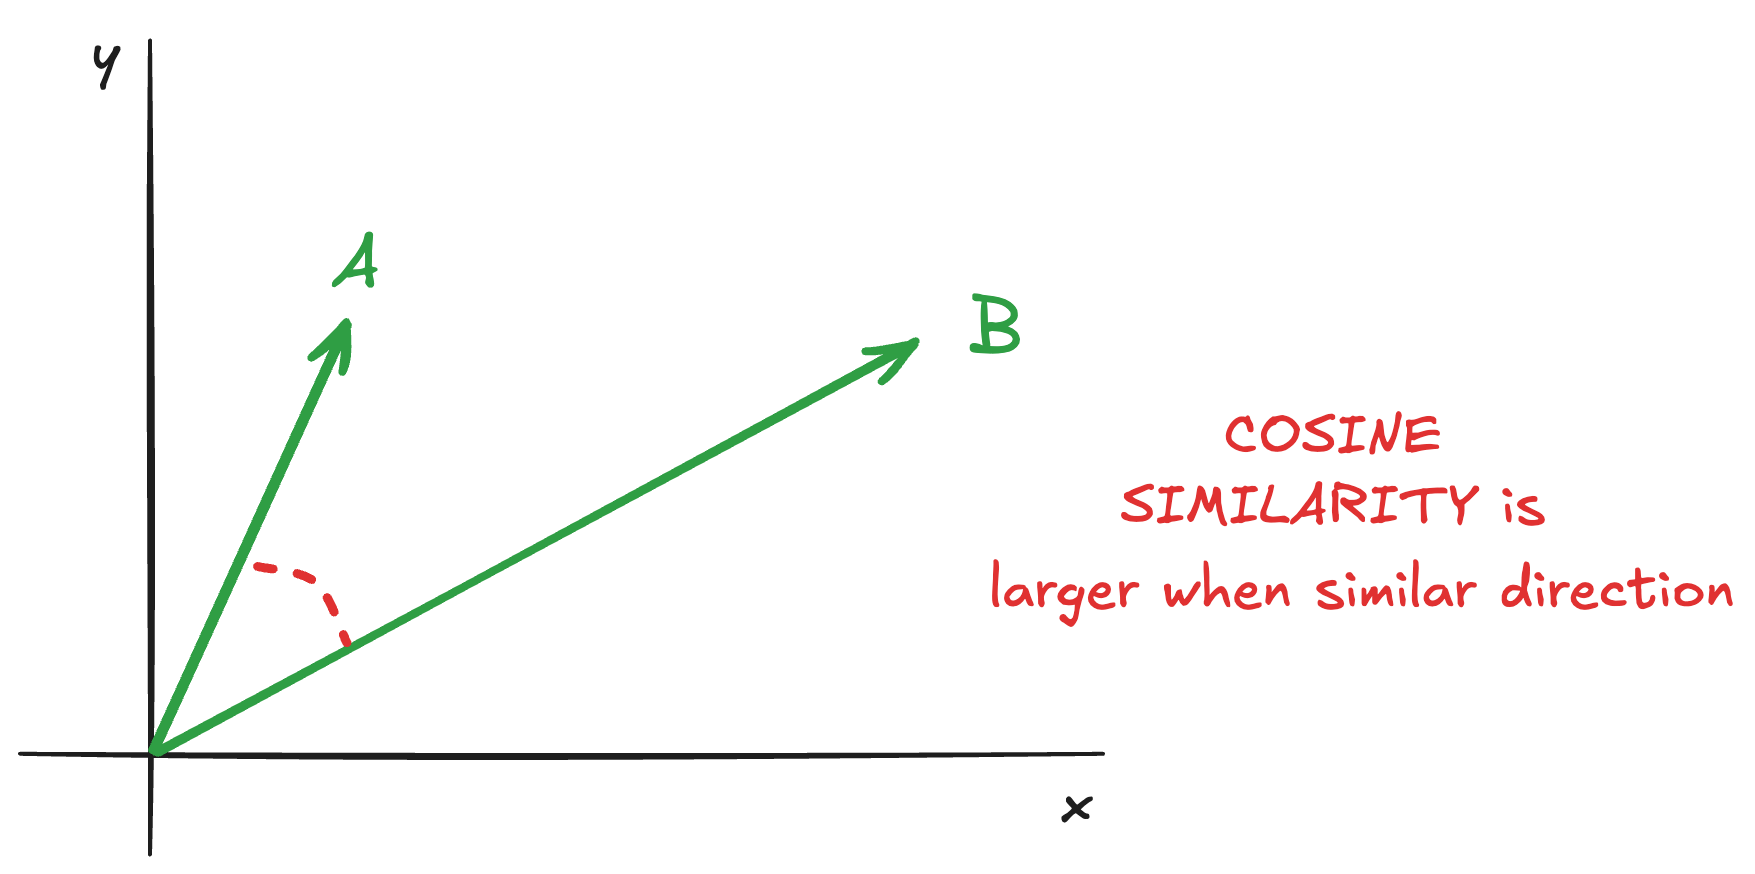
A wonderful function for using that angle to describe similarity is cosine. This has its roots in trigonometry (and has
an important relationship to the different distances that Euclid and Pacman have to walk), but really its main value to us
is that it is at its maximum (1) when the angle is zero (i.e. our vectors are pointing in the same direction), at its minimum
(-1) when the angle is 180 degrees (i.e. our vectors are pointing in opposite directions), and interpolates nicely between
these extremes in a pleasing curve (with 90 degrees corresponding to zero).
Models that encode their meaning as a direction in the low-dimensional space are best interpreted using cosine similarity as the distance metric between their points.
It is however, a little complex to calculate:
1cos = (x1*x2 + y1*y2) / (math.sqrt(x1**2 + y1**2) * math.sqrt(x2**2 + y2**2))
There is a better way, but to use it we need certain conditions to be true.
Inner product
The inner product is one way of "multiplying" two vectors together - i.e. finding their product. Intuitively it can be thought of as finding how much one vector "projects" along the path of the other, and vice-versa:
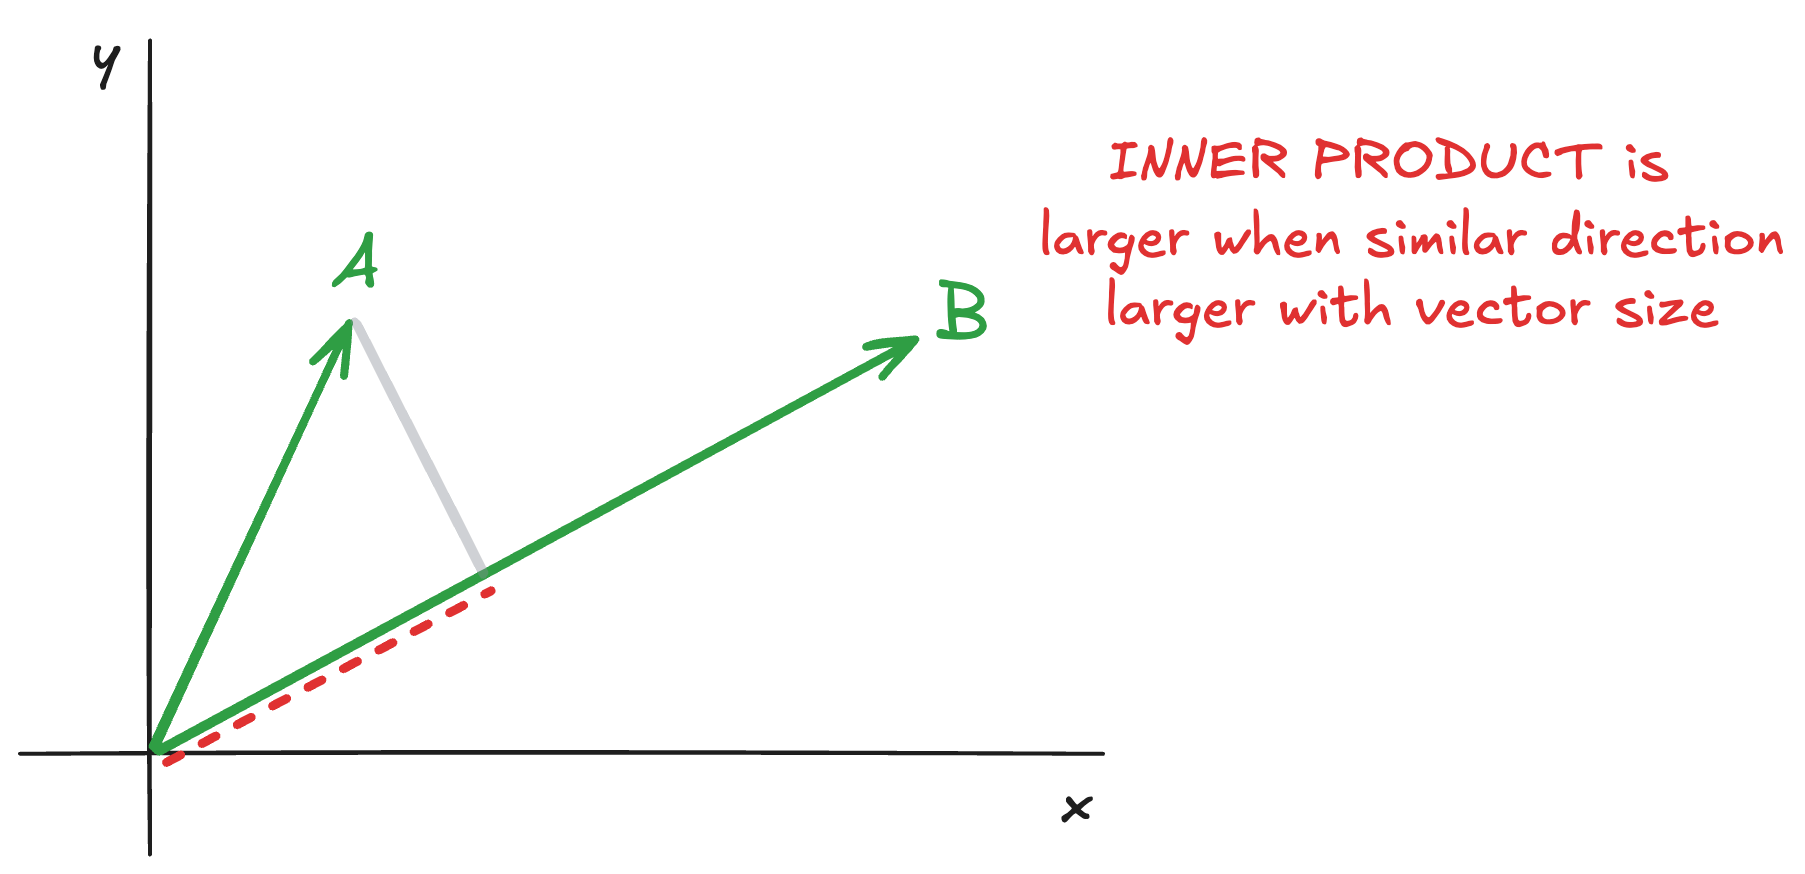
It is larger when the vectors point in the same direction, and it is also larger as the vectors grow. It is also often called the "dot product".
"Great, Chris, we learned about some obscure geometric measure, why do we care?" Well, hold on, because I'm getting there...
Unit-normalisation
Warning, this section title suffers from a serious case of maths jargon, but it's actually really simple to understand - "normalisation" just means to find the length of a vector, and "unit" is just another way of saying "1". So "unit normalisation" just means to resize all your vectors so that they are of length 1. Easy.
When our vectors are unit-normalised, thanks to good old trigonometry, inner product and cosine similarity both produce the exact same value. The mathematical proof for this isn't hard, but if you squint at the following diagram you can probably see it for yourself:
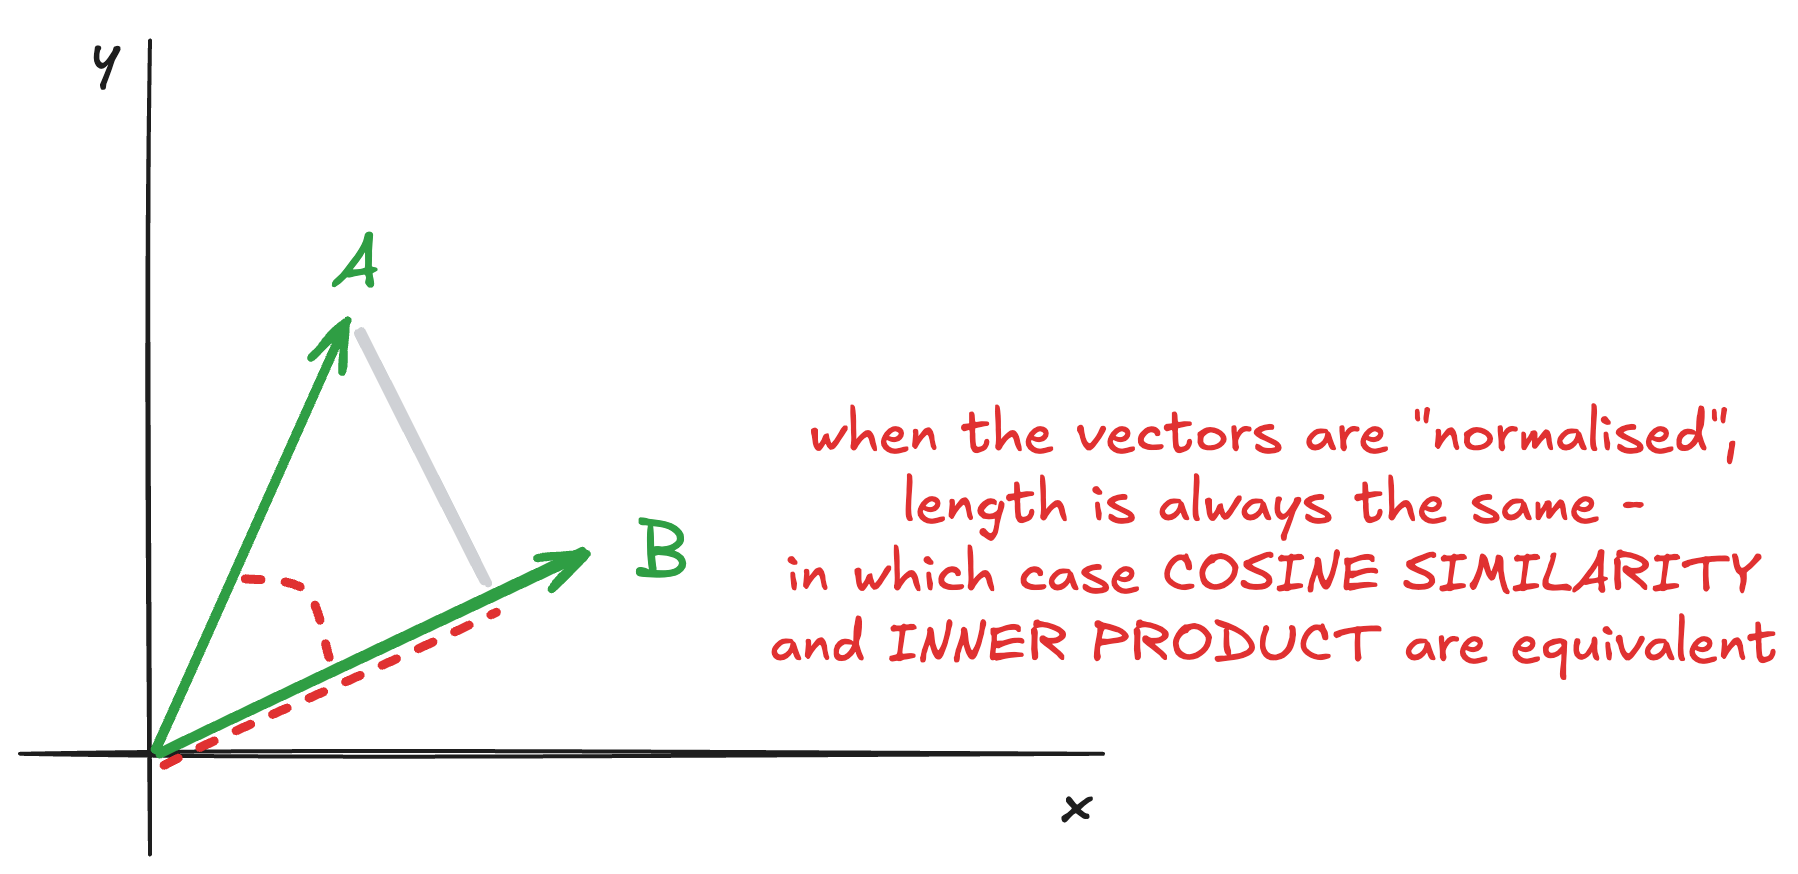
This is big news! It means if our model is trained to produce outputs of length one, or if we process the outputs to normalise them to length one ourselves after running them, we can use the inner product to exactly calculate the cosine similarity!
"Yeah yeah, so we jumped through all those hoops, and now we can use the inner product instead of cosine similarity. I still don't understand why that's a good thing..."
You will when you see how we calculate it:
1dot = x1 * x2 + y1 * y2
Boom! The dot product is incredibly simple and fast to calculate, and that is why for many embedding models we jump through the hoops of having direction encode meaning, and outputs be normalised, so we can use this very simple and computationally efficient way to measure distance in our low-dimensional space.
Summary
There are many different ways of measuring how similar the multidimensional outputs of a machine learning model are to each other. We touched on a few common and obvious ones here, and hopefully you now have some understanding for why inner product is such a useful tool for comparing vectors - particularly in a vector search context where you may have to calculate similarity between many thousands of different vectors to get to the right answer.
The key things to remember when you're picking which one to use:
- Make sure you understand which metric the model was trained against, as you need to choose a compatible metric.
- Consider algorithmic complexity when choosing between equivalent metrics, particularly if performance is a consideration.
- When choosing between cosine similarity and inner product, check whether the outputs are normalised or not.
